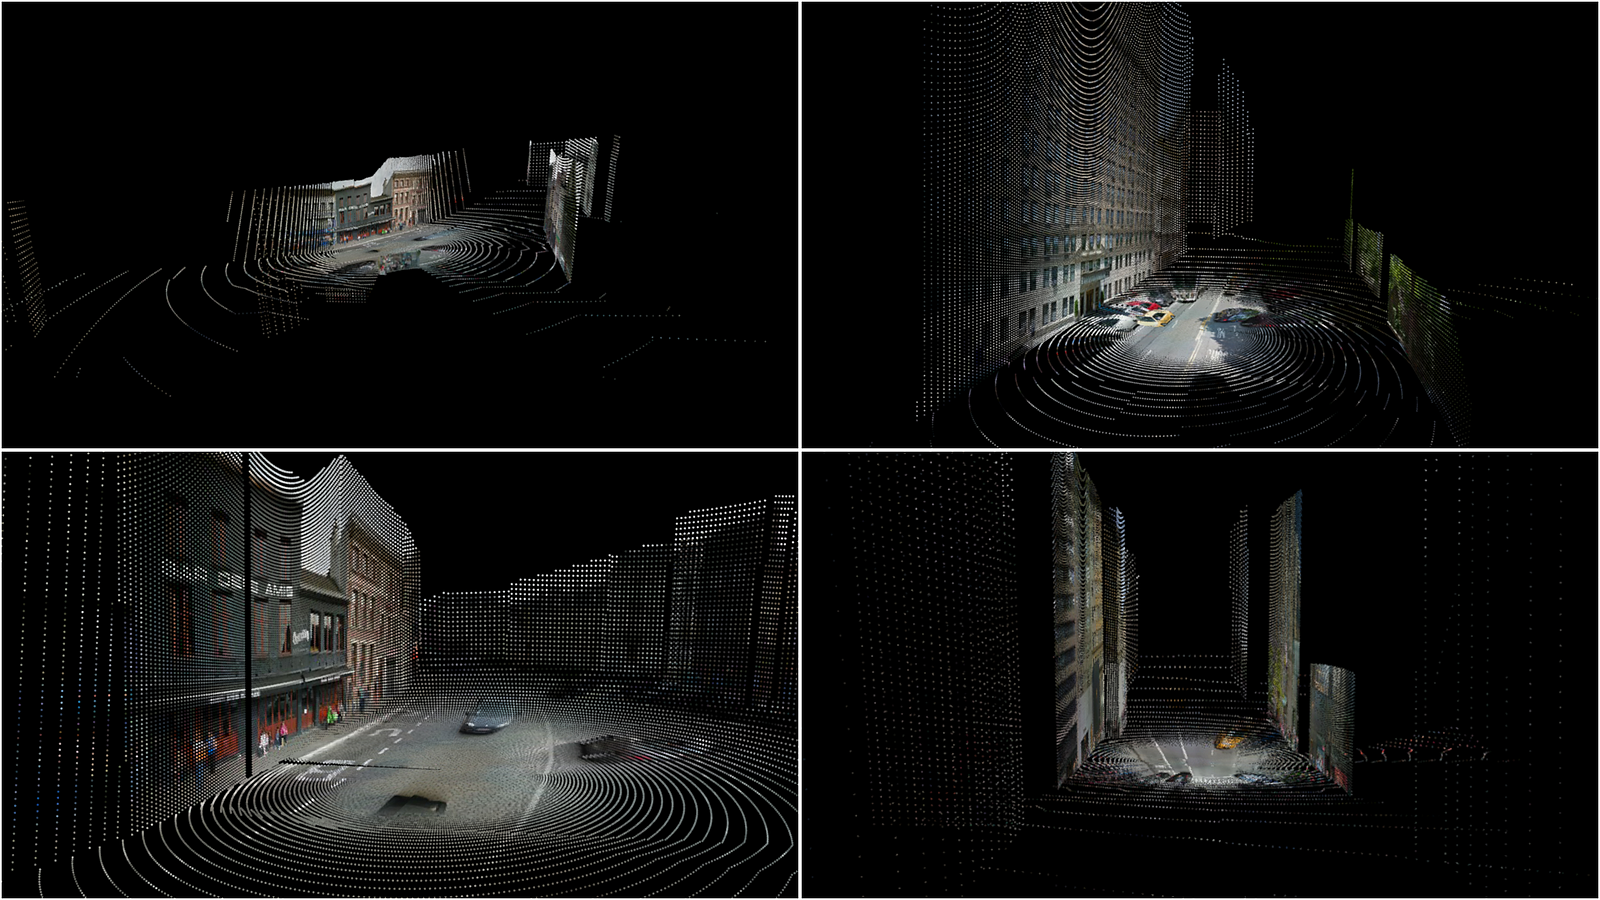
We were experimenting with creating 3d cityscapes in real time. One of the data sources we looked into was Google Street View.
It is not documented and not a part of their open api but Google does provide us with depth map information for each panorma.
It is not documented and not a part of their open api but Google does provide us with depth map information for each panorma.
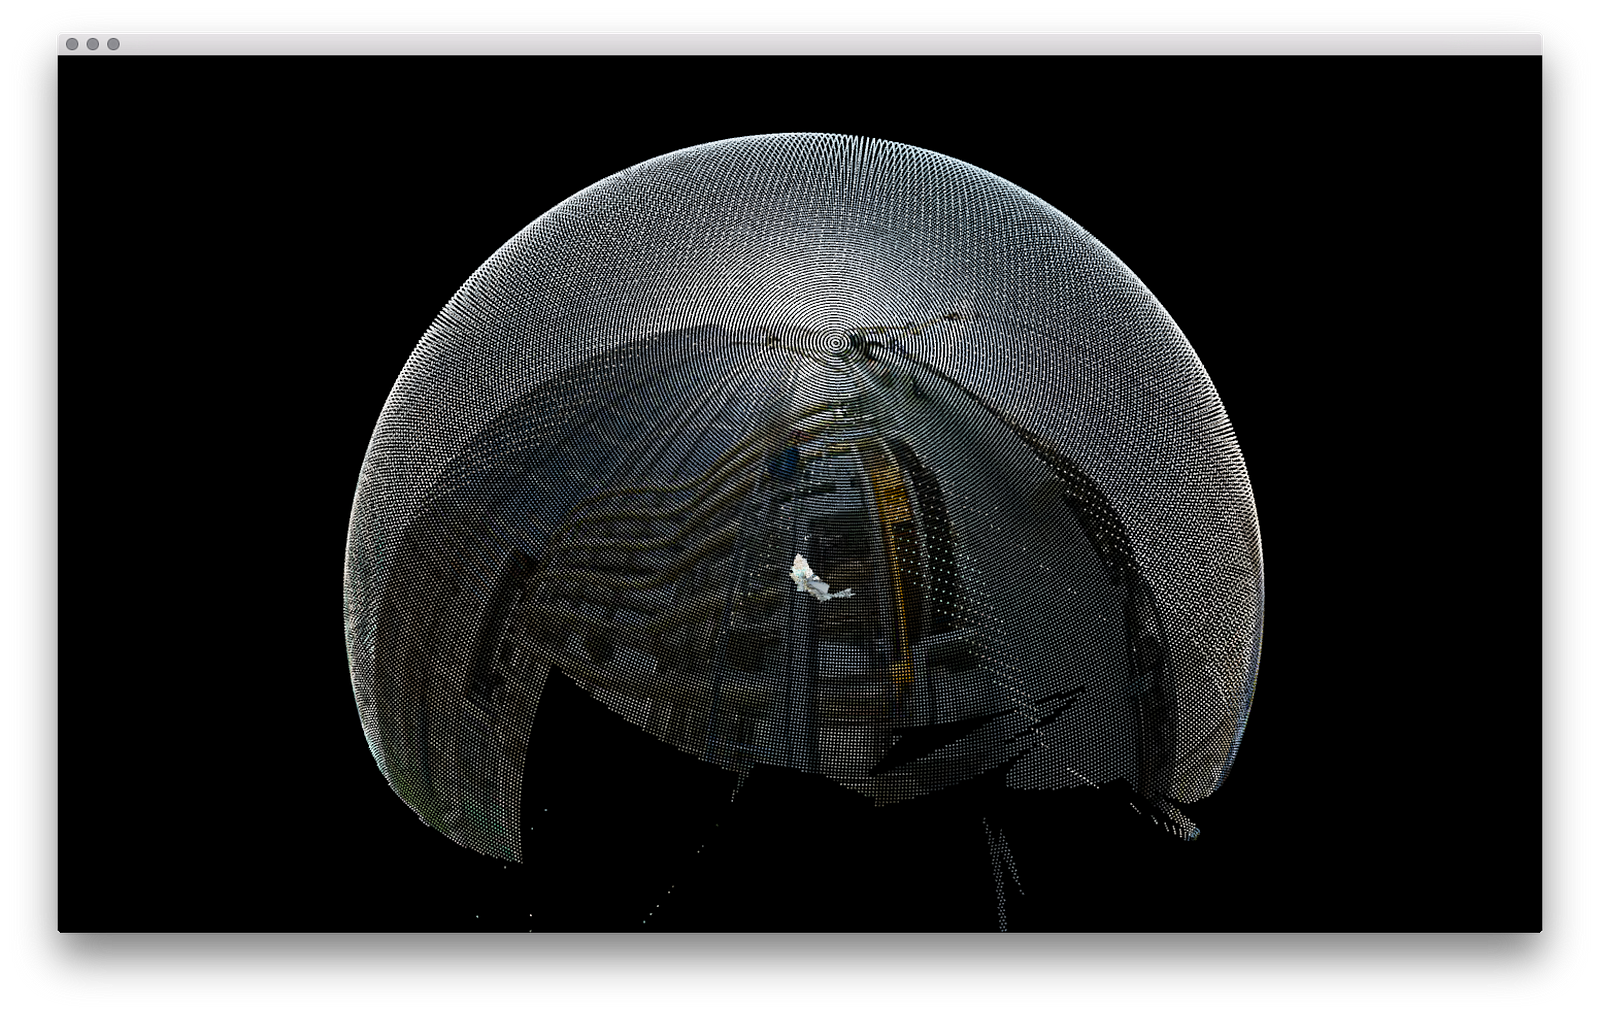
This enables us to create beautiful point cloud scenery.
If you wanna know more about how this works, please keep on reading!
It all started out with this document we found by Marco Cavallo.
https://www.evl.uic.edu/documents/3drecomstrictionmcavallo.pdf
https://www.evl.uic.edu/documents/3drecomstrictionmcavallo.pdf
You can consider this article as a practical implementation of the theory presented in Cavallo’s document.
Basically it boils down to this:
1. Get the Google Street View data
2. Compose an rgb panorama
3. Compute the depth map
4. Create the point cloud
2. Compose an rgb panorama
3. Compute the depth map
4. Create the point cloud
For all of our coding we used openFrameworks.
All the code used in this article can be found here:
1. ACCESS THE DATA
You can access the street view data with these urls:
Let’s use lat: 40.7625000 lon: -73.9741670 which corresponds to 717 5th Ave New York or the Trump Tower address… #whynot
You must add some parameters to get the desired data fi:
http://maps.google.com/cbk?output=xml&ll=40.7625000,-73.9741670&dm=1
http://maps.google.com/cbk?output=xml&ll=40.7625000,-73.9741670&dm=1
output: can be xml or json
ll: is a comma separated list with two variables: latitude and longitude
dm: is a boolean value to indicate you want to include depth map data or not.
ll: is a comma separated list with two variables: latitude and longitude
dm: is a boolean value to indicate you want to include depth map data or not.
Please note that these url’s are not officially part of the Google Street View api.
2. COMPOSE THE PANORAMA
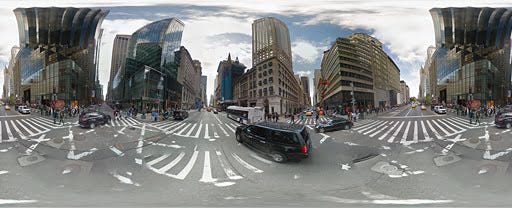
We need to get the spherical bitmap corresponding to our latitude and longitude coordinates. We need this image because later on we have to map the colors of it to the vertices of our point cloud.
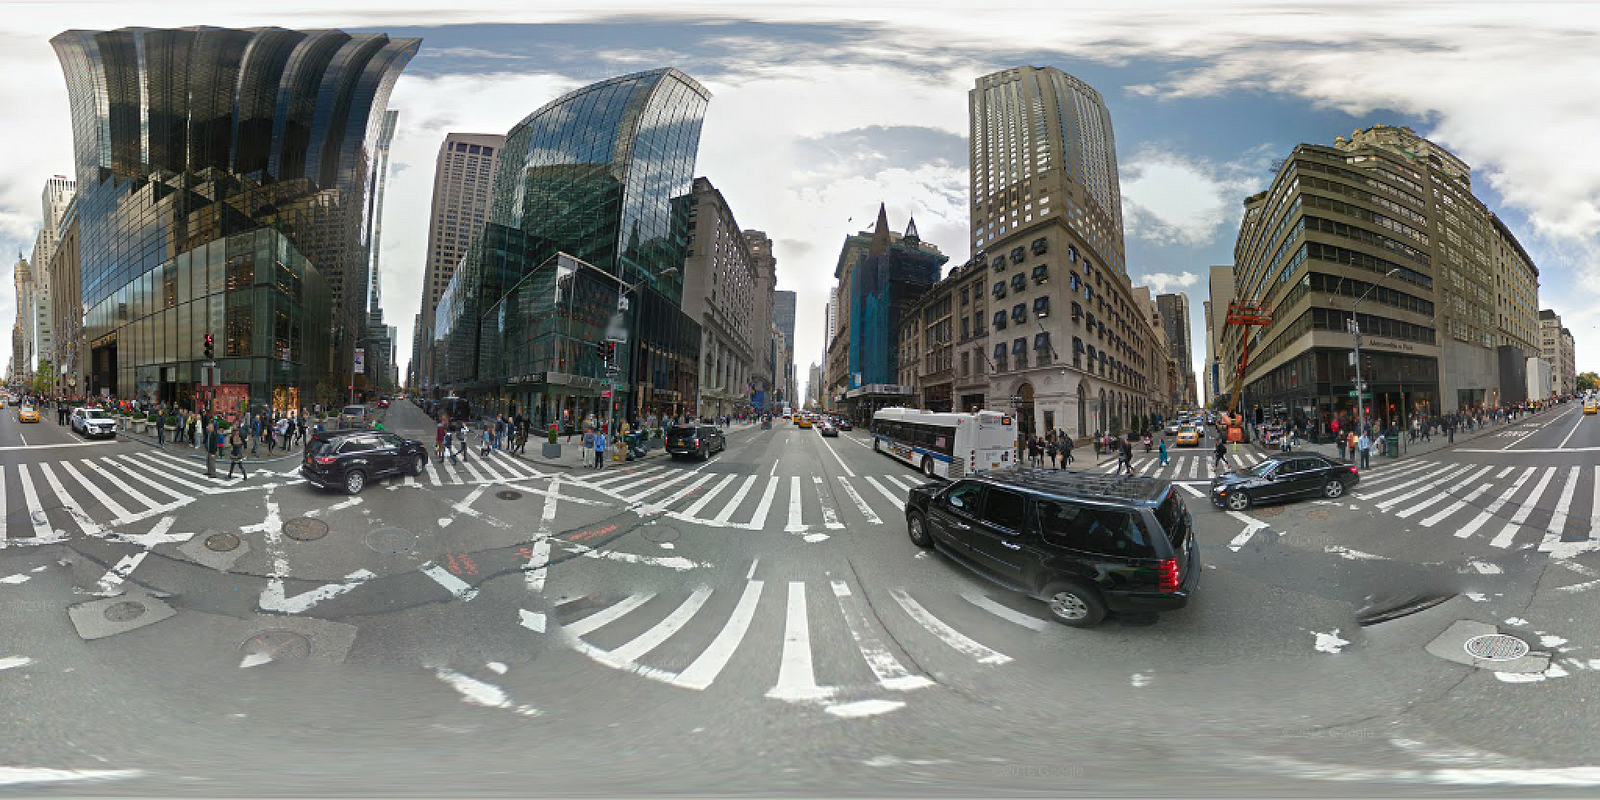
Of course, Google does not return the image like this. That would be to easy right? They come as tiles in a grid. To get an image like the one above we need to stitch the different tiles together.
This is the format of the url used to get a hold of the tiles:
output: must be ‘tile’
panoid: the pano id. This was obtained when getting the data.
zoom: the desired zoom level. This represents the dimensions of the image
x: the column number
y: the row number
panoid: the pano id. This was obtained when getting the data.
zoom: the desired zoom level. This represents the dimensions of the image
x: the column number
y: the row number
Every tile that Google returns has a dimension of 512x512.
The zoom, the x and y variables are connected and it took me some time to figure out how the tiling system works and how the images are related to each other.
Let’s see what an image looks like at zoom level zero:
http://maps.google.com/cbk?output=tile&panoid=03s2pUakx4X6Whp_NUDo0Q&zoom=0&x=0&y=0
http://maps.google.com/cbk?output=tile&panoid=03s2pUakx4X6Whp_NUDo0Q&zoom=0&x=0&y=0
It is a 512x512 image but the dimensions of the ‘not black’ part are 512x208.
512x208 is a 2.4 ratio and this does not seem to make much sense now does it?
What is clear about this image is, that it is not seamless. You can clearly notice that on the right hand side, a part of the left hand side is mirrored. Obviously we do not want that.
After some Photoshop measuring, cutting and cropping, it turns out that a 416x208 image gives us a perfect seamless image. And guess what? That is a ratio of 2.0. Obviously this bitmap is originally intended to be mapped on a sphere and the amount of pixels that needs to be cut off corresponds to PI/2which is 90 degrees. But more about that later when we start working with the depth map.
So with that out of the way the idea is to load all the images for a specific zoom size then stitch them together and then crop/resize until you have a 416x208 image in powers of two.
Now the grid seems to be working with this rule (somewhat…)
columns = 2^zoom
rows = 2^(zoom-1)
for example on zoom level 3:
columns = 2³= 8
rows = 2² = 4
for example on zoom level 5:
columns = 2⁵ = 32
rows = 2⁴ = 16
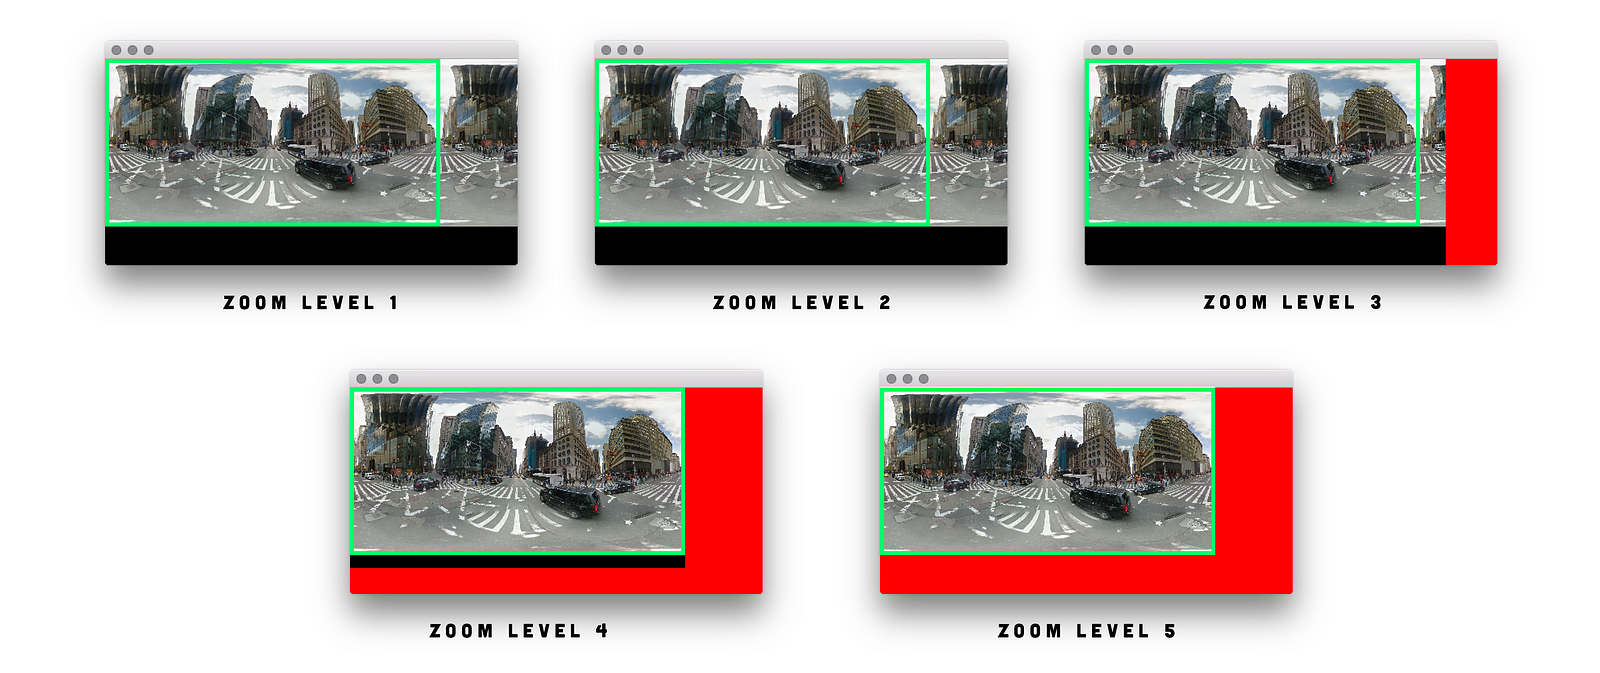
As I said this seems to be somewhat correct. If you stick by this rule you will notice some urls will give back ‘null’. But as long as you stick to the 416x208 in powers of two rule (ratio 2.0) you will always get a nice clean spherical bitmap.
Look at the image below. The red areas are areas where the Google service returned nothing for a particular tile at x,y. But it doesn’t matter because when you look at the green square, which is a 416x208 (in powers of two), you will always get the same panoramic image but just bigger or smaller according to your zoom level.
Below is some openFrameworks pseudo code to illustrate this process:
struct PanoTile {
int x;
int y;
ofImage image;
};
vector<PanoTile> tiles;
//INIT
zoom = 3.0f;
int cols= pow(2, zoom);
int rows= pow(2, zoom - 1);
for (int y = 0; y < rows; y++) {
      for (int x = 0; x < cols; x++) {
         load tile for [zoom][x][y]
      }
}
//WHEN A TILE IS LOADED
new PanoTile tile;
tile.x = x;
tile.y = y;
tile.image = incomingimage;
tiles.push_back(tile);
//WHEN ALL TILES ARE LOADED
//set correct width and height for true pano image
float panowidth = 416 * pow(2, zoom);
float panoheight = (416 * pow(2, zoom - 1));
//create a canvas with this width and height
ofFbo canvas;
canvas.allocate(panowidth,panoheight);
canvas.begin();
//draw the tiles in the canvas
for (int i=0,i<tiles.size();i++) {
     draw tile in canvas
     panoTiles[i].image.draw(panoTiles[i].x * 512, panoTiles[i].y * 512);
}
canvas.end();
canvas.draw();
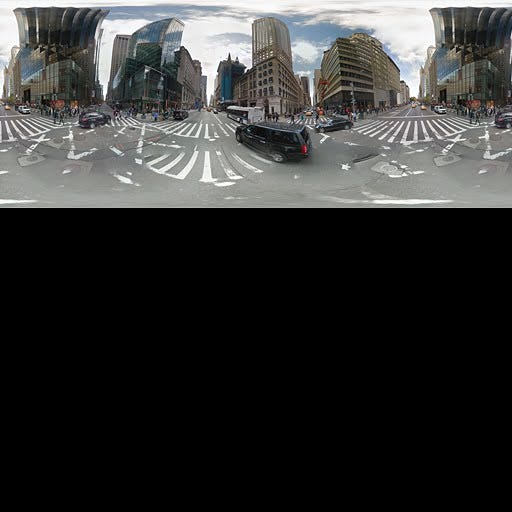
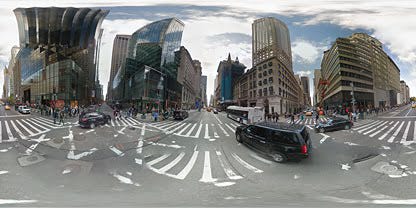
Actually for our purpose we do not need an image larger than zoom level 1.
The last thing we need to do is flip the image horizontally to map it for use with our depth map later on.
The last thing we need to do is flip the image horizontally to map it for use with our depth map later on.
openFrameworks pseudo code to flip the image
ofPushMatrix();
ofTranslate(width, 0, 0);
ofScale(-1, 1, 0);
//DRAW YOUR STUFF HERE
ofPopMatrix();
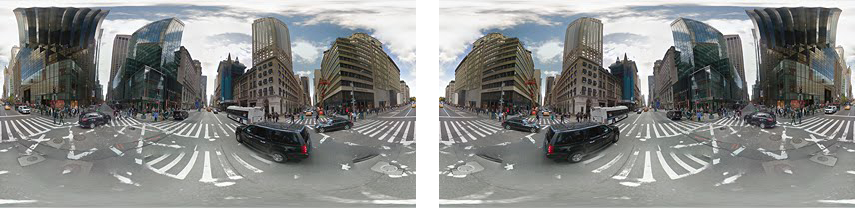
So at this point we have the nice clean panoramic image we are looking for.
Check out the full source code for creating the pano image here:
https://github.com/wearenocomputer/ofxGSVImageStitcher
3. COMPUTE THE DEPTH MAP
The raw data we are going to work with should look something like this:
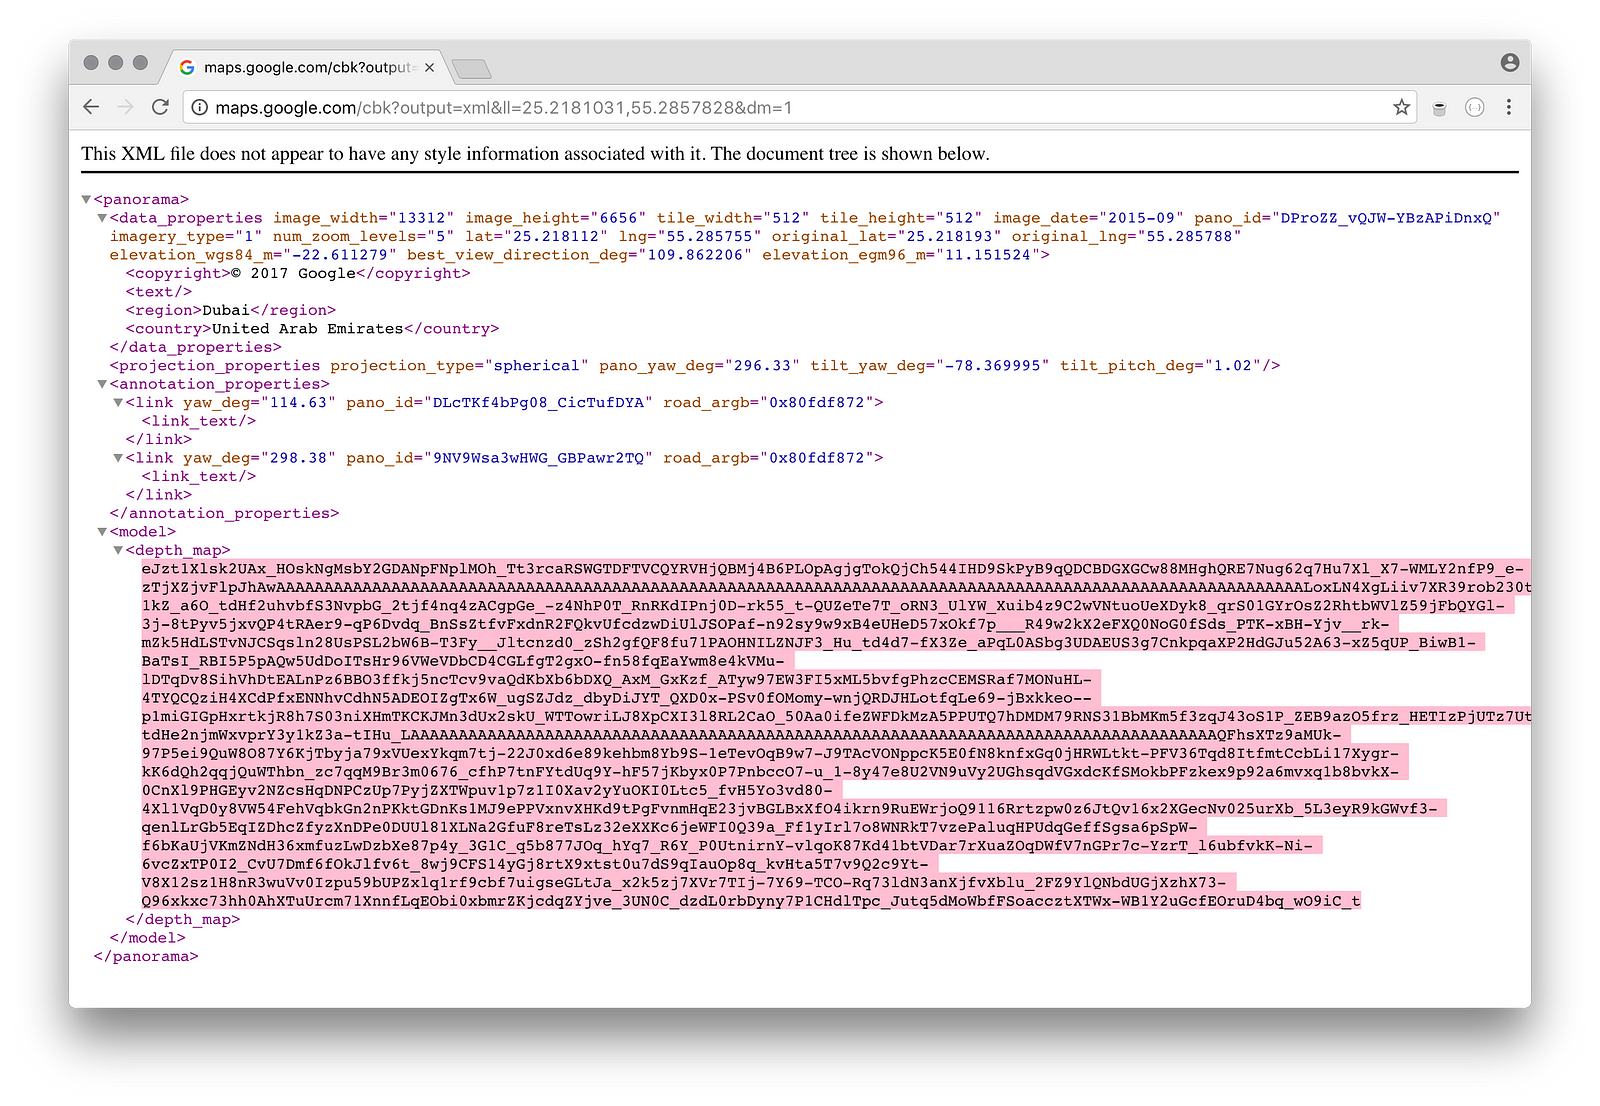
We have to turn this chunck of data into numbers that we can understand. As stated in Marco Cavallo’s paper, the data presented by Google is Base64 encoded. To be more precise, it seems to be Base64 encoded zlib compressed.
Actually this project ‘Streetview-Explorer’ by Paul Wagener deals with all of this very well.
https://github.com/PaulWagener/Streetview-Explorer
https://github.com/PaulWagener/Streetview-Explorer
Check out this file to see how he did it:
https://github.com/PaulWagener/Streetview-Explorer/blob/master/src/Panorama.cpp
https://github.com/PaulWagener/Streetview-Explorer/blob/master/src/Panorama.cpp
In our project we used this class for base64 decoding by Jan-Henrik Haukeland http://alien.cern.ch/cache/monit-4.9/http/base64.c and the zlib library which comes with Xcode for Osx or the version at zlib.net for Windows for uncompressing the data.
Some C++ code to illustrate decoding and uncompressing the data.
vector<unsigned char> depth_map_compressed(depth_map_base64.length());
int compressed_length = decode_base64(&depth_map_compressed[0], &depth_map_base64[0]);
//Uncompress data with zlib
unsigned long length = 512 * 256 + 5000;
vector<unsigned char> depth_map(length);
int zlib_return = uncompress(&depth_map[0], &length, &depth_map_compressed[0], compressed_length);
if (zlib_return != Z_OK) {
cout<<"unable to decompress depthmap"<<endl;
return;
}
Now that we have our data ready in the form of vector<unsigned char> we can extract the necessary information from it. This is what we can find in it:
- General information
- Depth map indices
- Depth map planes
General information contains stuff like:
- map width and height
- number of planes
- bitt offset
What is this number of planes thing? What does it refer to?
In the dataset, there are an arbitrary number of planes included. The amount of planes can be different for each panorama you use.
Each of these planes is described by a normal vector and it’s distance to the camera. The camera is in the center of the panorama. Or maybe, to be more precise, where it was mounted on the Google car.
Each of these planes is described by a normal vector and it’s distance to the camera. The camera is in the center of the panorama. Or maybe, to be more precise, where it was mounted on the Google car.
Bit offset is the offset used to access the next chunk from our uncompressed array of unsigned chars but seems to default to 8 (bits)
Depth map width and height seem to default to 512x256. Which is different from our bitmap image 416x208. This does not impose any problems because they both have 2.0 dimension factor.
The depth map indices is a list of integers:
This list is as long as the amount of pixels. In this case 512x256 = 131.072 values. Each integer in this list is the id of a plane (to be precise this integer is it’s position in the list of planes). This tell us on which plane this pixel belongs to.
The depth map planes is a list of ‘planes’:
We now already know how much planes we have, but here we can find the actual data for each plane. We define it like this:
struct DepthMapPlane {
//normal vector
float x, y, z;
//distance to camera
float d;
};
This is some C++ code on how we access these 3 chunks of data :
//...decodeBase64 //zlib uncompress etc..
vector<unsigned char> depth_map(length);
//GENERAL INFORMATION
int numberofplanes = depth_map[1] | (depth_map[2] << 8);
int mapwidth = depth_map[3] | (depth_map[4] << 8);
int mapheight = depth_map[5] | (depth_map[6] << 8);
int offset = depth_map[7];
//DEPTH MAP INDICES
//the values in this vector correspondent to a planeId this pixel belongs to
vector <unsigned char> depthmapIndices = vector<unsigned char>(mapheight * mapwidth);
memcpy(&depthmapIndices[0], &depth_map[offset], mapheight * mapwidth);
//DEPTH MAP PLANES
vector<DepthMapPlane> depthmapPlanes = vector<DepthMapPlane>(numberofplanes);
memcpy(&depthmapPlanes[0], &depth_map[offset + mapheight * mapwidth], numberofplanes * sizeof(struct DepthMapPlane));
Now comes the tricky part. Calculating the depth value for each pixel.
The formula’s can be found in Marco Cavallo’s article:
https://www.evl.uic.edu/documents/3drecomstrictionmcavallo.pdf
https://www.evl.uic.edu/documents/3drecomstrictionmcavallo.pdf
Basically what we need to do is to compute the distance of each pixel to the camera. In order to do that we need to cast a ray from the camera to the plane corresponding with a pixel and then find the intersection point from the ray with the plane. From this intersection point we can derive it’s distance.
The paper however does not explain how the math actually works. So here’s an effort to shed some light on it.
These are the major steps we have to take:
1. ‘Normalize’ the 512x256 ‘pixel grid’ representing the indices.
2. Create yaw/pitch coordinates or azimuth/elevation angles for each ‘pixel’ in the grid. Which gives us a direction vector for each index.
3. Convert these coordinates from spherical to cartesian
4. Find the distance (intersection point) of this direction vector with the plane.
It’s important to realise we are creating a spherical depth map. Therefore we have to think in ‘spherical space’. This means we have to give each pixel in our 512/256 grid a ‘lookat’ direction.
Imagine it like this: We have a blank bitmap with dimension 512/256. In the end we have to fill each pixel with a color corresponding to a depth value, resulting in a spherical depth map.
- Before we map our 512/256 x/y coordinates to a sphere we have to ‘normalize’ them.
That means bringing the coordinates from a 0->511 to a 0->1 space for x and from a 0->255 to a 0->1 space for y.
We do this by using an equation like this:
normalized = currentval/(widthorheight-1)
But for use in a 3d environment we need to flip the coordinates.
So these are the final equations:
normalizedx = currentx-width-1/width-1
normalizedy = currenty-height-1/height-1 - Now in order to give each of these indices a ‘lookat’ direction we multiply the normalized values with (2*PI) + (PI/2) for x which gives us a yaw angle in radians and multiply with PI for y which gives us a pitch angle in radians. 2*PI in radians equals 360 degrees and PI to 180. So for yaw we work with a range in 360 degrees (left/right) and for pitch we work with a range in 180 degrees (up/down)
The only ‘funny’ thing is the ‘+PI/2’ to calculate the yaw value. It would make more sense to just do this: normalizedx*(2*PI) right?
Now PI/2 is 90 degrees. If we do not add PI/2 to calculate the yaw value we get the same repetition as we had with the spherical bitmap. Remember we had to cut it from 512 to 416 pixels? That corresponds with the PI/2 value!yaw = normalizedx * (2 * PI) + (PI / 2);
pitch = normalizedy * PI; - The next thing we need to do is to convert these angles (radians) to cartesian coordinates. This is done with these equations: x=sin(pitch)*cos(yaw)
y=sin(pitch)*sin(yaw)
z=cos(yaw)
cfr http://keisan.casio.com/exec/system/1359534351 - Now we need to retrieve the corresponding plane for each of our indices in our 512/256 grid. Once we have this, we take the distance variable from that plane (that is the distance from the camera, our centerpoint, to the plane) and divide it with the addition of the products from our x,y,z coordinates with the planes normal vector.
It looks like this:
radius = plane.distance/(x*plane.x + y*plane.y + z.plane.z)
The only thing we have to do now is take the absolute value for this radius/distance. When mapping onto a sphere negative distances make sense, but when remapping them onto a 2d image the radius needs to be positive.
So the final equation becomes this:
radius = abs(plane.distance/(x*plane.x + y*plane.y + z*plane.z))
Note that all values with a depth of zero are considered to be the sky.
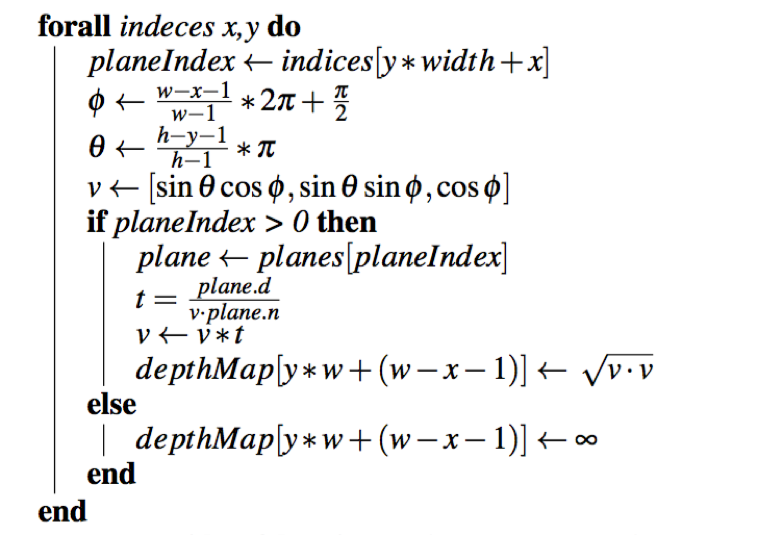
Written out in code, all this theory looks like this:
Written out in code, all this theory looks like this:
vector<float> depthmap;
depthmap.resize(width*height);
for (int y = 0; y < height; ++y) {
     for (int x = 0; x < width; ++x) {
       float xnormalize =(width-x-1.0f)/(width-1.0f);
       float ynormalize =(height-y-1.0f)/(height-1.0f);
       float theta = xnormalize * (2 * PI) + (PI / 2);
       float phi = ynormalize * PI;

       //convert from spherical to cartesian coordinates
       vector<float> v;
       v.resize(3);
       v[0] = sin(phi) * cos(theta);
       v[1] = sin(phi) * sin(theta);
       v[2] = cos(phi);

       int planeIdx = depthmapIndices[y*width + x];

       if (planeIdx > 0) {
           DepthMapPlane plane = depthmapPlanes[planeIdx];
           float t = abs(plane.d / (v[0] * plane.x + v[1] * plane.y + v[2] * plane.z));
           depthmap[y*width + (width - x - 1)] = t;
       } else {
           depthmap[y*width + (width - x - 1)] = 0.0f;
     }
  }
}
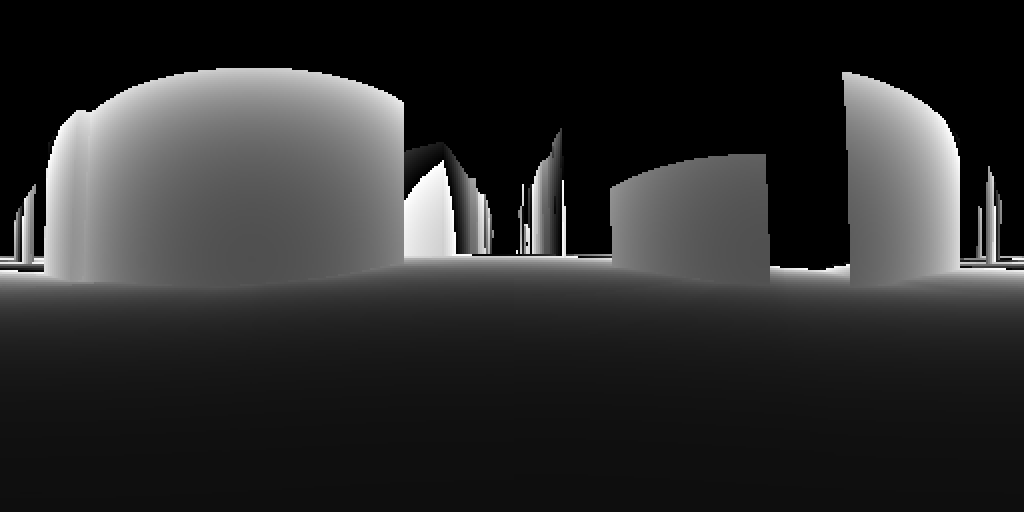
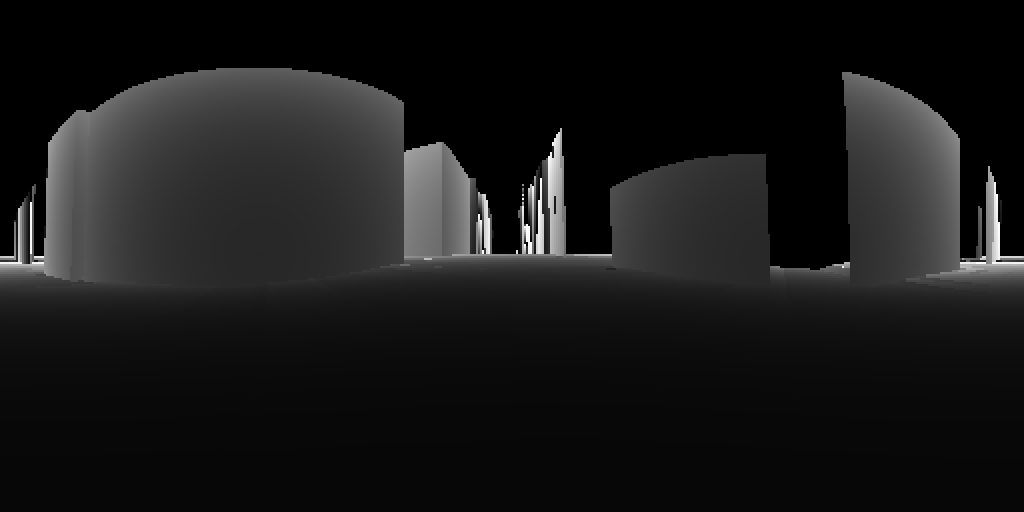
So at this point we have a vector of 512*256 filled with floating values each representing a depth for that pixel. And that is our depth map!
Now just for visualising it we take each of these values and divide them by 100 to ‘sort of’ normalize them between 0 and 1. And then multiply with 255 to become a grayscale value for each depth. This is pretty arbitrary and you can easily play with the amount to divide by.
Some openFrameworks pseudo code to illustrate how to visualise the depth map with grayscale values.
ofPixels depthPixels;
depthPixels.allocate(width, height, 1);
for (int y = 0; y < height; ++y) {
     for (int x = 0; x < width; ++x) {
          float c = depthmap[y*width + x] / 100 * 255;
          depthPixels[y*width + x] = c;
     }
}
ofImage image;
image.setFromPixels(depthPixels, width, height, OF_IMAGE_GRAYSCALE);
image.draw();
4. CREATE THE POINT CLOUD
Now it’s time to create the point cloud based on the spherical depth map data and the color information from our spherical bitmap image.
This is very easy to do because we actually already did it when creating the depth map. We map 512/256 indices on a sphere by giving them yaw/pitch, and convert them to cartesian coordinates. But now we also have a distance for each pixel. So we multiply the cartesian coordinates with this distance. We then look up the color in the bitmap image and we are done.
Here is some openFrameworks pseudo code on how to accomplish the point cloud. Most of this code is the same as when we were creating the depth map. Just make sure you have a 512/256 rgb panoramic image and note that for depth with value zero we multiply the position with 100. These points belong to the sky.
//Create an empty mesh to add vertices and color to
ofMesh pointcloud;
//Get the color pixel values from the rgb image
ofPixels mypixels;
mypixels.allocate(512, 256, OF_IMAGE_COLOR_ALPHA);
panofbo.readToPixels(mypixels);
for (int y = 0; y < height; y++) {
     for (int x = 0; x < width; x++) {
          float xnormalize = (width-x-1.0f)/(width-1.0f);
          float ynormalize =(height-y-1.0f)/(height-1.0f);
          float theta = xnormalize * (2 * PI) + (PI / 2);
          float phi = ynormalize * PI;

          float depth = depthmap[y*width + x];
               if (depth != 0) {
                    pos = pos*depth;
               } else {
                    pos = pos*100.0f;
          }
          pointcloud.addVertex(pos);

          int r = (int)mypixels[4 * (y*width + x)];
int g = (int)mypixels[4 * (y*width + x) + 1];
          int b = (int)mypixels[4 * (y*width + x) + 2];

          pointcloud.addColor(ofColor(r, g, b, 255));
      }
}


ナゴヤディビジョン: New >>>>> Download Now
ReplyDelete>>>>> Download Full
ナゴヤディビジョン: New >>>>> Download LINK
>>>>> Download Now
ナゴヤディビジョン: New >>>>> Download Full
>>>>> Download LINK